A good way to market a new infrastructure tool is to loudly announce that it is a thousand times faster than whatever you are currently using. This is a very effective strategy because nobody wants to be the person using a slower database.
A few weeks ago, SpacetimeDB launched their v2 with exactly this premise. They released a slick video explaining that traditional web architecture—where your server talks to your database over a network—is fundamentally broken. The solution, they argue, is to just put your application code inside the database.
And to prove it, they showed a chart. This chart is basically a graveyard of modern infrastructure. They lined up Postgres, PlanetScale, Convex, CockroachDB and a few others, and declared victory over all of them.
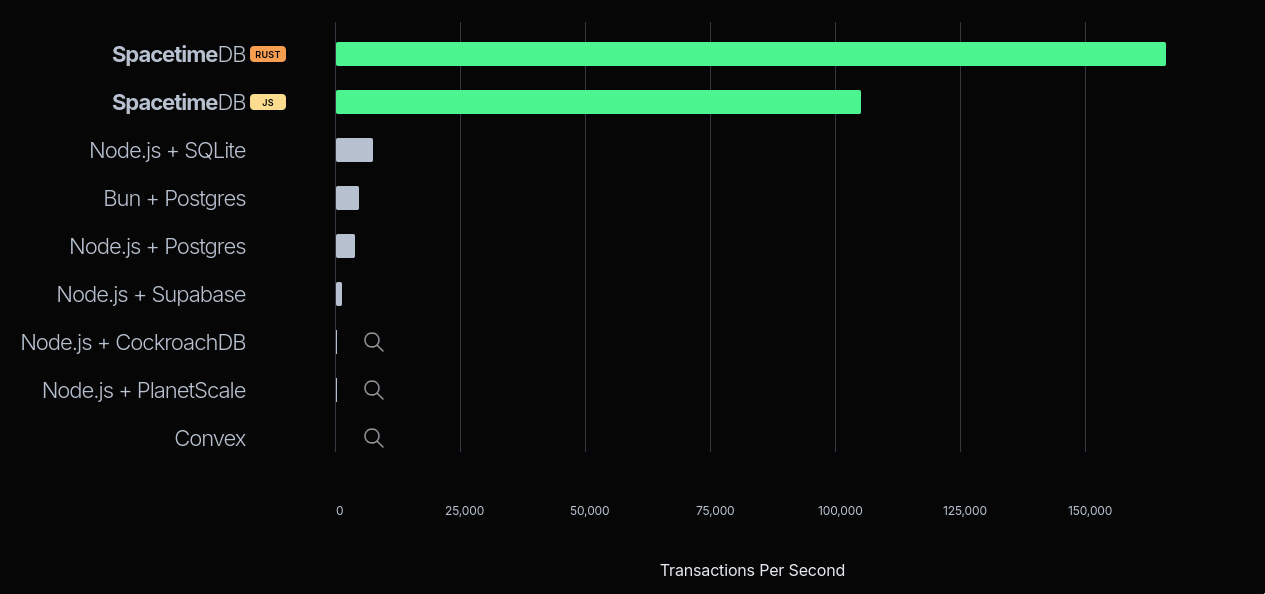
First of all, you have got to love the cheeky little magnifying glass icons they added next to Convex, PlanetScale, and CockroachDB. Just to drive home how microscopic their numbers supposedly are.
But if you ignore that for a second, something else immediately stands out.
| Setup | TPS |
|---|---|
| SpacetimeDB (Rust) | 167,915 |
| SpacetimeDB (JS) | 104,485 |
| Node.js + SQLite | 7,416 |
That 7K TPS number for Node.js + SQLite is so clearly, obviously off that I just had to clone their code and try to reproduce the results myself.
Unlike the other databases on that list, SpacetimeDB and a Node.js + SQLite server share the exact same architectural paradigm: colocated compute and storage. The application and the database live on the exact same machine. There is no network boundary. Which makes the gap between them look suspicious.
Naturally, a benchmark chart like this raised eyebrows, sparked skepticism, and generated plenty of discussion. Vincent, an ex-PlanetScale engineer, wrote a great technical teardown shortly after the launch. He raised good questions about high availability, cluster deployments, and the perils of forcing your application and database to fight for the same CPU and RAM. Valid points.
He also reasonably questioned whether SpacetimeDB was skipping durability—the part where the database actually promises your data is safely written to the hard drive before returning a success message—to hit these astronomical numbers.
But they aren’t. SpacetimeDB has a flag (withConfirmedReads), which was enabled during the benchmark, that ensures transactions are durably committed—actually flushed to the disk—before the server acknowledges the client.
So the secret sauce isn’t skipping durability; it’s something else. That SQLite number was still very wrong, and I needed to find out why.
Bare metal and broken code
I’m going to run the benchmark on my personal Linux machine. I have a 13th Gen Intel Core i7-13700K, 32GB memory, and a local NVMe SSD.
Since we are about to talk a lot about database durability and disk bottlenecks, here is a quick dd test to establish a baseline for this disk.
tanay:~$ dd if=/dev/zero of=fsync_test bs=4k count=1000 oflag=dsync1000+0 records in1000+0 records out4096000 bytes (4.1 MB, 3.9 MiB) copied, 0.683005 s, 6.0 MB/sWe are copying small blocks of data one after the other synchronously to the disk. Divide the total time taken by the number of blocks copied, and you roughly get the write latency of the disk.
1000 blocks copied in 0.683s. That’s a write latency of 683 microseconds.
Roughly 5x faster than your usual EBS volume, which makes sense—EBS is network-attached storage with far better durability guarantees than a local NVMe drive. For comparison, here’s the same test on EBS:
tanay:~$ dd if=/dev/zero of=fsync_test bs=4k count=1000 oflag=dsync1000+0 records in1000+0 records out4096000 bytes (4.1 MB, 3.9 MiB) copied, 3.8657 s, 1.1 MB/s3.86ms per write.
Still, my local SSD is relatively slow. If you use a good bare-metal server (like the AWS EC2 i7i series), you could get write latencies down to 76 microseconds:
tanay:~$ dd if=/dev/zero of=/mnt/nvme-data/fsync_test bs=4k count=1000 oflag=dsync1000+0 records in1000+0 records out4096000 bytes (4.1 MB, 3.9 MiB) copied, 0.0760506 s, 53.9 MB/sWhy is write latency so important? More on that soon.
We can now clone their repository, install all the dependencies, set the env variables, run the prep script, and reproduce the results, right?
Wrong. The benchmark—especially for their own SpacetimeDB test—was broken out of the box. I ranted about it on X, and their founder Tyler invited me to their Discord to help get things running. Their engineering team was polite and responsive. They acknowledged a few bugs, some old code that broke during their v2 migration, and shipped a patch.
Except, the benchmark was still broken.
So, I’m only going to focus on the SQLite numbers. Once SpacetimeDB fixes their benchmarking code, I’ll update the results here. I have no doubt that 100K–160K TPS is possible with their architecture. But as we’ll see, it’s possible for SQLite, too.
Initial results and more broken code
Running the benchmark is easy. First, we run the Node.js + SQLite RPC server:
pnpm tsx src/rpc-servers/sqlite-rpc-server.tsThen we run the benchmark client with the default settings SpacetimeDB used:
pnpm tsx src/cli.ts --seconds 10 --concurrency 50 --alpha 1.5 --connectors sqlite_rpcThe benchmark runs for 10 seconds. Concurrency of 50 means we’ll start 50 simultaneous connections (workers) to our RPC server. There’s also a hidden maxInflightPerWorker parameter, which is the number of open, unresolved requests a worker can hold at a time. We aren’t passing it explicitly just yet, but keep it in mind—it’s going to become relevant soon.
In a Zipfian distribution, alpha controls skew—higher values mean more users
hit the same accounts, which raises contention. In a multi-writer database,
that kills throughput through lock contention. But SQLite and SpacetimeDB are
both single-writer systems. There are no locks. So contention actually
helps: repeated hits on the same accounts warm the CPU cache. I’m keeping
alpha=1.5 because that’s what SpacetimeDB used.
The first run
The first result I got surprised me.
tanay:~$ pnpm tsx src/cli.ts --seconds 10 --concurrency 50 --alpha 1.5 --connectors sqlite_rpc...sqlite_rpc.ts: { tps: 12682.8, samples: 126828, p50_ms: 3.457, p95_ms: 5.971, p99_ms: 9.431, ...}Wait. 12,682 TPS? That is already almost double the 7,416 they show on their graph. 1
This number is also impossibly wrong. Not because it’s too low. Because it’s too high.
By default, SQLite runs in journal_mode=delete. In this mode, SQLite does TWO fsync calls to the physical disk per transaction. First, it fsyncs the old data (the rollback journal). Then, it updates the main database and waits for a second fsync.
When an application writes data, the operating system usually caches it in
memory and immediately says “done!” for speed. But if someone unplugs the
server right then, that data vanishes. To actually guarantee durability, the
database must issue an fsync system call. This forces the OS to physically
write the data to the storage drive, and the database halts until the hardware
returns a thumbs-up. That physical wait time is the disk latency.
If my disk takes 683 µs per write, two fsyncs take 1,366 µs.
1 second (1,000,000 µs) / 1,366 µs = a theoretical maximum of ~732 TPS.
So how in the world is the benchmark reporting 12,000 TPS on a disk that physically maxes out at 732?
I put my AI agent (opencode) to work debugging the benchmark’s server code, and we found this:
db.transaction((tx) => {  const rows = tx    .select()    .from(accounts)    .where(inArray(accounts.id, [fromId, toId]))    .all();
  if (rows.length !== 2) {    throw new Error("account_missing");  }
  // ...[balance math logic here]...
  tx.update(accounts)    .set({ balance: Number(newFrom) })    .where(eq(accounts.id, fromId));
  tx.update(accounts)    .set({ balance: Number(newTo) })    .where(eq(accounts.id, toId));});
Can you spot the issue with this Drizzle ORM code?

The update statements are never RUN.
Drizzle requires you to call .run() at the end of an update statement to actually execute the query against the database. Because it was missing, there was no execution. No disk writes. No waiting for fsync.
The benchmark wasn’t measuring database writes. It was just measuring the speed of Node.js executing a database SELECT and throwing some JSON in the garbage.
So, I fixed the code, added the .run() calls, and reran the script.
tanay:~$ pnpm tsx src/cli.ts --seconds 10 --concurrency 50 --alpha 1.5 --connectors sqlite_rpc...sqlite_rpc.ts: { tps: 360.8, samples: 3608, p50_ms: 133.759, p95_ms: 166.271, p99_ms: 276.991, ...}360 TPS. With a p50 latency of 133ms.
Now this makes way more sense. Our theoretical max was ~732 TPS. Add in the Node.js event loop overhead, IPC, the HTTP roundtrip, and Drizzle’s ORM overhead, and 360 TPS is exactly where you expect standard, double-fsync SQLite to land on this disk.
We have found the true baseline. Now, let’s fix it.
Getting SQLite to 160K TPS
We are at 360 TPS. SpacetimeDB is at 167,000 TPS. How do we bridge the gap?
By giving SQLite the exact same architectural privileges that SpacetimeDB gave itself.
Fix #1: Breaking the double-fsync
Nobody running a high-throughput application uses SQLite in journal_mode=delete. It is the absolute slowest configuration possible.
The first step is turning on Write-Ahead Logging (WAL). We’ll keep synchronous=FULL, which means SQLite still waits for the fsync to complete before returning success. No durability shortcuts. We’re still flushing every committed transaction to the physical drive.
db.run("PRAGMA journal_mode=WAL;");db.run("PRAGMA synchronous=FULL;");Why does this matter? In the default mode, SQLite has to wait for two physical disk writes. In WAL mode, SQLite simply appends the new transaction to the end of the Write-Ahead Log (fsync #1) and returns success immediately. The actual main database file is updated later in the background.
We still preserve 100% of our durability guarantees—if the server crashes, SQLite recovers all committed transactions from the WAL—but we just halved our physical disk wait time.
tanay:~$ pnpm tsx src/cli.ts --seconds 10 --concurrency 50 --alpha 1.5 --connectors sqlite_rpc...sqlite_rpc.ts: { tps: 1201, samples: 12010, p50_ms: 40.319, p95_ms: 49.439, p99_ms: 84.799, ...}1,201 TPS. By removing exactly one fsync, we more than tripled our throughput. Our latency also dropped from 133ms down to 40ms.
(Pause here if you’d like. Can you figure out why the latency dropped so drastically from removing just 0.683ms of disk wait time?)2
From our earlier calculation, if 2 fsyncs gave us a theoretical cap of 732 TPS, 1 fsync should get us to ~1,464 TPS. We’re still slightly short. The bottleneck has moved.
Fix #2: Apples, oranges, and network protocols
SpacetimeDB keeps using the phrase “apples-to-apples”.
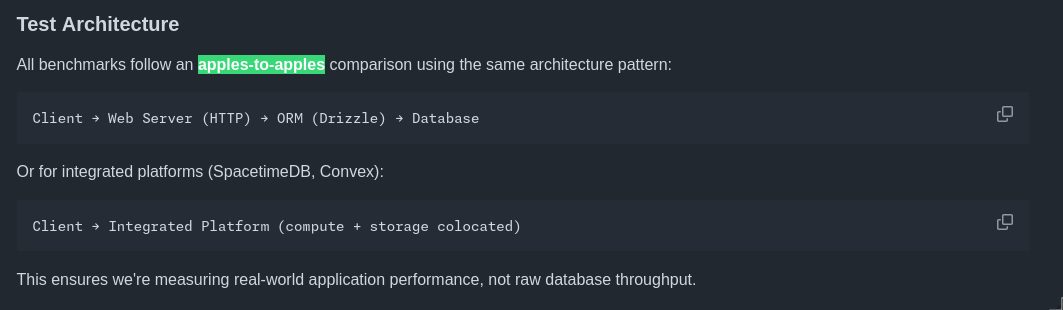

But if you look at the benchmark setup, SpacetimeDB’s apple is a runtime communicating over an active, stateful WebSocket connection. The connection opens once, and thousands of transactions flow through the pipe.
The SQLite apple is a Node.js server forced to spin up a brand-new, stateless HTTP request lifecycle for every single RPC call. TCP handshake, JSON parse, HTTP handler, DB query, JSON serialize, HTTP response. Over and over again.
Is this a database benchmark? Or an HTTP overhead benchmark?
If you care about latency and throughput, this is a workable problem. You don’t need a new database runtime to keep your application code and storage on the same machine. It’s straightforward to rewrite the SQLite RPC to use WebSockets instead of HTTP.
So, I wrote a new SQLite RPC server that communicates over WebSockets instead.
pnpm tsx src/rpc-servers/sqlite-ws-rpc-server.tsLet’s try it out.
tanay:~$ pnpm tsx src/cli.ts --seconds 10 --concurrency 50 --alpha 1.5 --connectors sqlite_ws_rpc...sqlite_ws_rpc.ts: { tps: 1478.6, samples: 14786, p50_ms: 31.663, p95_ms: 37.983, p99_ms: 64.991, ...}1,478 TPS. Our TPS went up, and our latency dropped again to 31ms, because we stopped forcing Node.js to construct and parse HTTP headers on every request.
Look at the math. SQLite is a single-writer database. My disk takes exactly 0.683 milliseconds to execute a single fsync.
1,000ms / 0.683ms = ~1,464 TPS.
We’ve stripped away all the overhead. We’re now bottoming out directly against the physical write latency of the NVMe SSD.
Fix #3: The physics of batching
We are at ~1,500 TPS. Nowhere near 160,000.
At first, this seems like a hard wall. If durability costs 0.683ms per write, aren’t we capped? We can’t make the disk faster.
Shouldn’t SpacetimeDB also hit the same wall? Are they doing some insane Rust wizardry to speed up the disk?
No. That’s impossible.
Think about it like transportation. We have a bridge, and crossing it takes exactly 0.683ms. A bicycle crosses the bridge carrying one passenger (transaction). You can only move ~1,464 passengers across per second.
The only way to move more people without breaking the speed limit is to upgrade the vehicle. You swap the bike for a bus. The bus also takes 0.683ms to cross the bridge. The bridge speed hasn’t changed. But the bus can now carry 100 passengers at a time.
Batching.
Once we know what to do. It’s straightforward to implement in Node.js.
I added a simple batching queue: accumulate up to 10 requests, or wait 2 milliseconds—whichever comes first—then flush the entire batch with a single fsync.
SQLITE_WS_RPC_BATCH_SIZE=10 SQLITE_WS_RPC_BATCH_MS=2 pnpm tsx src/rpc-servers/sqlite-ws-rpc-server.tsCross your fingers.
tanay:~$ pnpm tsx src/cli.ts --seconds 10 --concurrency 50 --alpha 1.5 --connectors sqlite_ws_rpc...sqlite_ws_rpc.ts: { tps: 13438, samples: 134380, p50_ms: 2.861, p95_ms: 5.111, p99_ms: 7.403, ...}13,438 TPS. And our p50 latency dropped to 2.8ms.
The math checks out. Our disk maxes out at ~1,464 fsyncs per second. Group 10 transactions per fsync (1,464 × 10) and our physical ceiling is 14,640 TPS. We’re nearly there.
But wait—our latency dropped to 2.8ms. We introduced extra waiting with batching. Why is it lower?
Because of head-of-line blocking. With 50 concurrent workers, every request waits in a single queue. Without batching, each request waits for all the individual fsyncs ahead of it—the median request sits behind roughly 25 separate disk writes. With a batch size of 10, those 50 requests collapse into at most 5 groups. The median request now waits for a handful of batches instead of a long chain of individual disk writes. That’s why the queue time collapses.
So, if batching 10 gets us 13K TPS, batching 100 should get us 130K, right?
tanay:~$ pnpm tsx src/cli.ts --seconds 10 --concurrency 50 --alpha 1.5 --connectors sqlite_ws_rpc...sqlite_ws_rpc.ts: { tps: 14467.8, samples: 144678, p50_ms: 2.047, p95_ms: 3.769, p99_ms: 5.047, ...}Hmm. 14,467 TPS. We barely moved.
Remember that maxInflightPerWorker parameter I mentioned at the start and told you to keep in mind? Here it is.
The default SQLite benchmark restricts the client to maxInflightPerWorker=1. With 50 concurrent workers, there are never more than 50 requests sitting at the server at any given moment.
Our bus holds 100 people. But there are only 50 people at the bus stop.
The bus never fills up. The database sits idle, waiting for the 2ms timeout to fire and the next trickle of requests to arrive.
The SpacetimeDB Secret
SpacetimeDB sets maxInflightPerWorker to 1 for the SQLite connector. But they set it to 16,384 for their own benchmark.
How did SpacetimeDB get 167K TPS? By keeping the bus stop permanently packed. With 16,384 in-flight requests per worker, batches fill instantly and throughput is maximized.
(Note: In their demo, they show only TPS—not p50, p95, or p99. Flooding the server with in-flight requests maximizes throughput while destroying latency. 50 workers × 16,384 in-flight = 819,200 unresolved requests in memory.)
We now have three knobs to play with: batch size, batch timeout, and in-flight requests per worker. Let’s dial them up gradually.
With batch=100 and 8 in-flight per worker, the bus stop is finally busy:
tanay:~$ SQLITE_WS_RPC_BATCH_SIZE=100 SQLITE_WS_RPC_BATCH_MS=2 pnpm tsx src/rpc-servers/sqlite-ws-rpc-server.tstanay:~$ MAX_INFLIGHT_PER_WORKER=8 pnpm tsx src/cli.ts --seconds 10 --concurrency 50 --alpha 1.5 --connectors sqlite_ws_rpc...sqlite_ws_rpc.ts: { tps: 51753, samples: 517531, p50_ms: 6.439, p95_ms: 10.119, p99_ms: 12.607, ...}51,753 TPS. With a p50 of 6.4ms.
You don’t need 800,000 concurrent requests to saturate a single-writer database. You just need enough to keep the batching window full. Let’s push further—batch=200, inflight=40:
tanay:~$ SQLITE_WS_RPC_BATCH_SIZE=200 SQLITE_WS_RPC_BATCH_MS=2 pnpm tsx src/rpc-servers/sqlite-ws-rpc-server.tstanay:~$ MAX_INFLIGHT_PER_WORKER=40 pnpm tsx src/cli.ts --seconds 10 --concurrency 50 --alpha 1.5 --connectors sqlite_ws_rpc...sqlite_ws_rpc.ts: { tps: 109508, samples: 1095080, p50_ms: 14.767, p95_ms: 31.407, p99_ms: 37.087, ...}109,508 TPS. Doubling the batch size roughly doubled the throughput. Let’s keep going—batch=1000, inflight=80:
tanay:~$ SQLITE_WS_RPC_BATCH_SIZE=1000 SQLITE_WS_RPC_BATCH_MS=2 pnpm tsx src/rpc-servers/sqlite-ws-rpc-server.tstanay:~$ MAX_INFLIGHT_PER_WORKER=80 pnpm tsx src/cli.ts --seconds 10 --concurrency 50 --alpha 1.5 --connectors sqlite_ws_rpc...sqlite_ws_rpc.ts: { tps: 137528, samples: 1375280, p50_ms: 22.287, p95_ms: 46.687, p99_ms: 52.415, ...}137,528 TPS. The gains are compressing. We’re running into a CPU ceiling now, not a disk one. Let’s try batch=2000:
tanay:~$ SQLITE_WS_RPC_BATCH_SIZE=2000 SQLITE_WS_RPC_BATCH_MS=2 pnpm tsx src/rpc-servers/sqlite-ws-rpc-server.tstanay:~$ MAX_INFLIGHT_PER_WORKER=80 pnpm tsx src/cli.ts --seconds 10 --concurrency 50 --alpha 1.5 --connectors sqlite_ws_rpc...sqlite_ws_rpc.ts: { tps: 157436, samples: 1574359, p50_ms: 23.135, p95_ms: 29.999, p99_ms: 35.519, ...}157,436 TPS. And finally, batch=4000, inflight=120:
tanay:~$ SQLITE_WS_RPC_BATCH_SIZE=4000 SQLITE_WS_RPC_BATCH_MS=2 pnpm tsx src/rpc-servers/sqlite-ws-rpc-server.tstanay:~$ MAX_INFLIGHT_PER_WORKER=120 pnpm tsx src/cli.ts --seconds 10 --concurrency 50 --alpha 1.5 --connectors sqlite_ws_rpc...sqlite_ws_rpc.ts: { tps: 163075, samples: 1630751, p50_ms: 31.935, p95_ms: 45.023, p99_ms: 55.711, ...}163,075 TPS.
We did it. We touched SpacetimeDB’s benchmark numbers, maintained durable disk writes, and used nothing but Node.js and out of the box SQLite + Drizzle ORM.
Why did it stop at 160K?
If the disk can do 1,464 fsyncs per second and we’re batching 4,000 requests per fsync, shouldn’t we easily hit millions of TPS? And why did a batch size of 100 only give us 51K instead of the expected 140K? Why doesn’t the throughput scale linearly?
Because we traded the disk bottleneck for a CPU bottleneck.
Node.js is single-threaded, and better-sqlite3 is synchronous. When SQLite calls fsync, it blocks the entire Node.js process. The event loop freezes. No JSON parsing. No SQL execution. Just waiting.
Think about a 1-second time budget. Your process splits that second between two things:
- Sleeping while the disk fsyncs.
- Running your actual application code.
If you try to hit 140,000 TPS with a batch size of 100, you need 1,400 fsyncs per second.
1,400 × 0.683ms = 956 milliseconds frozen.
You have 44 milliseconds left to parse 140,000 JSON requests. 0.314 microseconds / request. Physically impossible.
But with a batch size of 4,000, you only need 40 fsyncs per second to reach 160,000 TPS.
40 × 0.683ms = 27 milliseconds frozen.
You’ve bought yourself 973 milliseconds of pure CPU time.
At 163,000 TPS, our single Node.js thread has exactly 6.25 microseconds per transaction to parse the WebSocket JSON, construct the query, traverse the B-Tree, and serialize the response. We haven’t just maxed out the disk; we’ve maxed out the processor.
Could we go faster? Yes. Drop Drizzle ORM for raw better-sqlite3 prepared statements, or swap the ws library for a C++ implementation like uWebSockets.js, and you’d squeeze tens of thousands more transactions out of this single core. You could also offload the database writes to a dedicated worker thread—keeping JSON parsing and WebSocket I/O on the main thread while a separate thread handles SQLite calls and blocks on fsync—so the two never compete for the same CPU time. Bridging the final gap between Node.js and a native Rust runtime is entirely possible. But 163K TPS proves the point.
The results
To recap: here is the actual story of the benchmark, told through the data.
| Setup | Inflight/Worker | TPS | p50 Latency |
|---|---|---|---|
| Fake Benchmark | 1 | 12,682 | 3.5ms |
| True Default SQLite | 1 | 360 | 133ms |
| WAL Mode | 1 | 1,201 | 40ms |
| WebSockets | 1 | 1,478 | 32ms |
| Batching (Batch=10) | 1 | 13,438 | 2.9ms |
| Batch=100, Inflight=8 | 8 | 51,753 | 6.4ms |
| Batch=200, Inflight=40 | 40 | 109,508 | 14.8ms |
| Batch=1000, Inflight=80 | 80 | 137,528 | 22.3ms |
| Batch=2000, Inflight=80 | 80 | 157,436 | 23.1ms |
| Batch=4000, Inflight=120 | 120 | 163,075 | 31.9ms |
| SpacetimeDB (JS) | 16,384 | 104,485 | not disclosed |
| SpacetimeDB (Rust) | 16,384 | 167,915 | not disclosed |
| SpacetimeDB’s Node.js + SQLite | 1 | 7,416 | not disclosed |
Standard, boring tech performs beautifully when you configure it properly.
Closing thoughts
If SQLite can hit 163K TPS on a single machine, why does SpacetimeDB exist?
Not for the performance.
SpacetimeDB as a product
SpacetimeDB is a cool piece of tech. But step back and think about what the WASM reducer model is actually solving: running user-generated code safely, supporting multi-tenant platforms where you can’t trust what’s being executed. Stuff that they need for their Maincloud offering.
Their v2 launch tried to expand the original pitch to general web apps—but deploying a web app and deploying a game server are two completely different problems.
And even for multiplayer games: if it’s your own code on your own server, there’s no untrusted code to sandbox. The WASM runtime buys you nothing. At that point, I’d rather roll my own application layer with SQLite or RocksDB as a storage engine than learn a proprietary runtime and get locked into it.
The licensing is also worth noting. SpacetimeDB is BSL-licensed. The open source release is enough to run a single node—that’s it. Clustering, replication, anything that looks like a real multi-node production setup is closed source and part of their Maincloud offering. The open-source version is primarily just marketing for that.
There are also rough edges throughout, and I wouldn’t recommend it for anything serious today.
On durability and production
163K TPS on a local NVMe is fun. But it is not a production setup. If that drive dies, the data is gone.
EBS is the obvious next step, but EBS has its own failure story that PlanetScale wrote about. Also worth knowing: EBS doesn’t replicate across availability zones. If cross-AZ replication matters to you, EFS handles this reasonably well—SQLite on EFS with a single writer is a workable setup.
There’s also a harder structural problem with the colocation pattern itself. Vertical scaling gets painful when your application server and your database are competing for the same CPU and RAM on the same machine. It’s not a dealbreaker, but it’s a real constraint.
One of the few offerings that actually does this pattern well is Cloudflare Durable Objects. You get low-latency local access with real durability guarantees. Because they replicate writes across a quorum before acknowledging a response (or “communicating with the outside world”) through something they call output gates. They scale horizontally. And there’s less lock-in than you’d expect since you write plain TypeScript and SQLite with an ORM like Drizzle if you like.
Infrastructure marketing will always try to convince you that your stack is broken and their new paradigm is the only way forward. But before you rewrite your backend, look at their code. You might just find they forgot to call .run().
Footnotes
-
SpacetimeDB’s benchmark docs list two server options: a PhoenixNAP bare-metal i9-14900k or a GCP c4-standard-32 with RAID 0 across five local SSDs. It’s unclear which they used. Either way, both run fast local storage—NVMe or local SSDs in RAID 0—putting disk writes roughly in the ~20–100 µs range. That’s far faster my dev machine, which makes this initial local result even more suspicious. ↩
-
Why did the latency drop so drastically? Because of head-of-line blocking. With 50 concurrent workers, request #50 is stuck in a queue behind 49 others. In
deletemode (double fsync = 1.3ms per request), the 50th request waits ~65ms just to start. Switch to WAL (single fsync = 0.68ms) and the line moves twice as fast—request #50 only waits ~34ms. Batching takes this further by collapsing the queue even more aggressively. ↩